As students enter 1st grade, they continue to work on math comprehension using early structures, like the Kindergarten journal we introduced last week, but now we begin to add visual models to the mix!
Let’s recap a child’s developmental journey through problem solving:
- In the early childhood years, a child needs lots of developmentally appropriate experience interacting with real objects in a physical world.
- The physical world is captured in a quantitative picture, which young children observe and use as a springboard for mathematical conversations.
- We transition into a more structured math work mat to help young students be able to connect numbers to words and words to numbers, still using familiar situations from real life.
- The math work mat gives way to a formal math journal in Kindergarten that makes use of math comprehension skills. It provides a structure for students to explain their understanding of numbers within real world situations that will carry on throughout elementary school.
Each of the stages of development builds on the skills developed in the previous step, so it is important that students aren’t rushed through these stages. The goal is to teach students the why behind the how so they aren’t just memorizing procedures but truly understand what is happening as they solve problems.
This 1st grade year is the last stage in the Math4Littles progression, in my opinion. After this, there isn’t much scaffolding, so we really want to carefully implement all the previous stages of problem solving before we turn the students loose, because we don’t want them to start guessing and checking. In taking students on this developmental journey, we are trying to build them a solid foundation for visual models to help them to understand problem solving.
How We Used to Teach Problem Solving
When I was teaching 1st grade, I remember a strategy that we used for problem solving called the C.U.B.S. method. Each of those letters stood for a step in the problem solving process so students could remember what to do: C – circle the numbers, U – underline the word, B – box the operation, S – solve the problem. Seems like a simple process that gives kids a really great structure to start to understand what words problems are asking, right? But what I realized is that this strategy doesn’t hold up long term.
 As a child was reading a part-whole addition or part-whole subtraction story, the boxing and underlining worked great. But when we got to comparison problems, it all fell apart.
“Shannon has 5 lollipop and Scott has 4 more lollipops than Shannon. How many do they have all together?”
I watched students follow that procedure with this type of problem. They circled the 4 and 5, underlined important information and put a box around the words all together, which means add because we’ve all seen the T-charts of addition/subtraction vocabulary – it says difference, it means we’re going to subtract, if you see all together, we’re going to add. But that strategy gives me 4, 5, and all together. If you go back to the question, you’ll realize the answer isn’t 9.
As I often do, I asked myself why? Why isn’t it 9? A little more reading comprehension is required to decode that answer. The problem says I had 5 lollipops. Scott had 4 more than me, which means he also had 5. Adding that up, he had 9 and I had 5, so there were 14 all together.
Why are we teaching kids procedures with concepts they don’t understand? Sometimes the strategies that we teach in math are conditional, meaning they only work for a certain amount of kids or a certain length of time. Then you have to worry about teaching them when to apply it and the rules for applying it, and what was meant to make things easier for students ends up being more complicated.
When we start working with strategies, I want to be able to find that vertical zip, meaning if I show you how this strategy might work in first grade, it has to work as the child gets older too so that they don’t have to learn a whole new set of strategies every year because every teacher teaches it differently. Honestly, the CUBS method would probably work for 75% of the problems in first grade. Students are doing more advanced part-whole addition problems, part-whole subtraction, part-whole missing addends, and they’ll start doing a few multi-step problems, all of which fit in the part-whole family, for which the CUBS method works well. But when you move out of that genre of problems, it falls apart.
 This is why, even in the Kindergarten journal, we use a coding system for our story problems. It’s for teachers and students to start to learn the different characteristics of the types of story problems that are out there, which will put them further ahead.
In the Kindergarten journal, we featured part-whole addition, part-whole subtraction, part-whole missing addend, a few problems with teen numbers, and a mixed review. The journal is very structured because it is intended to start students thinking about what they’re reading in the story problem: We have a story, a sentence form, a quick draw area, a number bond, a 10-frame, and a computation area. As they transition to 1st grade, how do we remove some of that scaffolding while still keeping it developmentally appropriate?
We have to be really careful with the way we make this transition, because very quickly, students can jump to the “circle the numbers, box the word” strategy and many times they just appeal to us because they don’t know what to do. It’s a word problem and it’s confusing, so they just add because we’re talking about adding that week.
Additive Comparison Problems
Additive comparison problems, where I have an amount and you have the same amount but you may have more or less than I do, are introduced after students have spent some time working on multi-step part-whole problems.
This type of problem is really a play on language, in my opinion, which makes it really confusing for kids to understand exactly what it is asking. So, we really want kids to take a step back to understand the additive comparison problems, which are coded AC in our journals. I find that building these problems with unfix cubes is a good way to start.
Let’s take this problem: Shannon has 10 pet rocks and Sherry has 4 pet rocks. How many more rocks does Shannon have than Sherry?
In some ways it seems like this might be a missing addend problem, but in fact we’re really comparing my pet rocks to Sherry’s pet rocks and we’re asking how many more does one have than the other. This really requires students to take it to the concrete level and make a bar model with unifix cubes.
I put 10 cubes to represent Shannon’s pet rocks, and then I’ll use different color cubes to show Sherry’s 4. Then, I want to compare the lengths of those two bars and figure out what the problem is really asking, which is the gap between where Sherry’s bar stops and Shannon’s bar stops. The question mark is asking for how many more does Shannon have?
Sometimes, the language of an additive comparison problem might be reversed and say how many less does Sherry have? Since it is a play on words, which sometimes becomes confusing for students, we really need to put thought into how we go about teaching kids to do a problem like this.
Visual Models for Additive Comparison Problems
If I were to line up all the programs we work with, every one of them has bit of a different name for visual models: model drawings, tape diagrams, bar models, unit bars. We’re going to universally call them visual models for word problems.
These aren’t the little quick draws we’ve been doing in Kindergarten because, as students get older and the problems get more complex, I’m not going to be able to draw 13 ducks and then 9 more because it will take too long! Instead, I want to put it into a visual model that has these units.
This first grade year is a transitional time where kids are going from the quick draw to what I’m going to call proportional bars, which have a length of individual cubes that are representative of the quantities we’re talking about in the problem.
 Say Erin has 4 books, but then she goes to the library and gets 3 more. Each cube or square represents a book, which helps kids go from the quick draw they did in Kindergarten to more formal structure. We could still put an X in the box to represent books that Erin had, and a circle in the boxes to represent the books that she got from the library, just to differentiate the two. The drawing is a comprehension tool, and we really focus less on answering the question than we do figuring out how to solve it. I think that’s the most misunderstood part of visual models.
I just was working with a first grade teacher last week on a Zoom call, and this teacher had not been able to attend our workshop on their campus about visual models. She, like most teachers I work with, didn’t understand why visual models were so important. She thought her students should be able to do quick draws and didn’t understand why they had to do boxes. She told me she was a big proponent of encouraging students to solve problems in different ways, so why would she possibly want to teach students a procedure like this and make them solve word problems in this way.
After I took her through the same progression of problem solving we’ve been going through in our blog the past few weeks, she was sold! I took her up through fifth grade to help her see why it is that, in 1st grade, we’re asking students to stop doing quick draws and start to use a visual model that has a unit bar with different pieces. This proportional model is also a great transition into using a non-proportional bar.
Let’s say I had 92 pet rocks and Sherry has 45 pet rocks. A quick draw clearly won’t work for this problem, and I don’t have enough room on my paper to draw a proportional model for those numbers. But I can draw a longer bar that represents Shannon’s rocks, write in 92 rocks, and draw a shorter bar to show Sherry’s 45 rocks so I could see the proportionality.
The hardest thing to remember when we do visual models for word problems is that it actually has nothing to do with math! We’re not actually solving the problem on the model; we are solely using a reading comprehension strategy.
One of the biggest misconceptions we addressed when we started rolling out the 1st grade journal samples that I’ll be using in this video, was that the total doesn’t go on the line. If the problem asks for a total, we represent that in the visual model with a question mark.
We also want to make sure that we label the visual model. For example, putting a B above the books that Erin had and an L above the books she got at the library.
The whole point of this process is to provide a systematic way for students to work through problems that doesn’t stop working after 1st grade or when you start working on a different type of story problem. In fact, this strategy carries through multiplicative comparison problems and fractions, all the way into ratios and proportions in middle school.
Step-by-Step Problem Solving
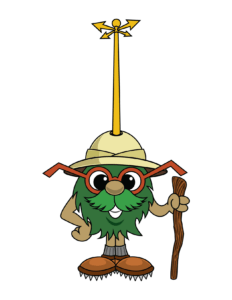 This step by step checklist that we use helps ensure that students will start to become more independent with this process as they go. We introduce it a little bit in Kindergarten as a more teacher-led process, but it is integrated into the first grade classroom as well where kids have a step-by-step visual model process to solve. As you can see in the examples, we have Professor Barble explaining the steps.
Read the problem. Then, have someone read it and repeat it, and every time a new piece of math information is presented, we’re going to put a chunk. So, as kids are reading the problem, they start to learn how to dissect what’s being asked.
Not all first grade students will be able to read the story problem, but this process is modeled day after day after day in the first grade classroom, so eventually the child will become independent.
I’m going to read a story problem: Mark has 9 strawberries, 6 of them are small. The rest are large. How many strawberries are large?
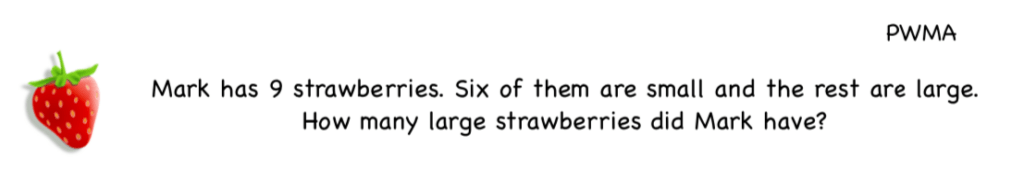
Then, I’ll go back and read it in chunks: Mark has 9 strawberries. This is a new piece of mathematical information, so students will repeat that statement back and highlight or put a line there. The students also like to say chunk! Then we continue reading: Six of them were small. I’ll stop, repeat it, and the students say chunk! as they mark that chunk in their journals. Now we have two pieces of mathematical information. Let’s continue: The rest were large. Repeat and then chunk! So, we’ve got three sections of information that the problem has given us that we need to replicate in our visual model. Finally, How many strawberries are large? Repeat that and then chunk!
By going through the problem slowly and methodically, students can really see these sections that they’re reading, and, as they’re going on to the subsequent steps of solving the problem, they can actually check off that they’ve included all the chunks of information in their visual model.
Create a sentence form. What is a sentence form? Simply put, it is stating what the problem is asking in a complete sentence. I can’t tell you how many times I’ve seen students solve story problems, and actually forget what they’re being asked because they’ve gotten so into the arithmetic and figuring out what they’re doing! So this step keeps them focused on what the problem is actually asking.
In our problem, it asked me how many strawberries are large? To put it in a sentence form, I would say: Mark has ____ large strawberries. I like to say Hmm for the ____ as we’re reading it out loud.
In Kindergarten, we provide the sentence for students, leaving the blank space for their answer. But in 1st grade, we take some of the scaffolding away. It might say “There were _____ large ____” and the students have to fill in the blanks.
The sentence form is a great way to make sure that kids are comprehending what they’re reading. Generally, students in first grade have a difficult time trying to create a sentence form, because they aren’t yet developmentally ready to give you a complete answer in reading. But students will be required to do a sentence form in 2nd through 5th grade so we can be sure they understand the problems being asked, so it’s really great practice to start in 1st grade with the scaffolding.
Proportional model. We start the 1st grade year with a proportional model. We may scaffold here for the who or the what, and students will eventually start to learn what goes in that visual model. In this case, we’re talking about all of Mark’s strawberries, even though the question itself is only asking about how many of them are large.
In a proportional model, you might see the 9 squares. This is a missing addend problem so that title is going to have PWMA at the top, and there will be exactly nine squares. Some people might think that’s giving it away, but remember the goal of visual models? It’s not to solve the problem but understand what’s going on in the problem, so we’re more concerned about whether or not the student can label the drawing correctly.
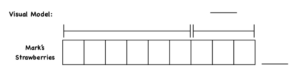
In this example, the student would total the bar at 9 and check off the first chunk of the problem that we read earlier – Mark has nine strawberries.
The next part says “6 of them are small.” In 6 of my boxes, I’ll make six Xs, or I might make small circles, and at the top I can either write small or abbreviate with an s.
Then it says “the rest are big.” I could label that other section of the boxes B for big, or write the whole word if I wanted. Then, I need to put a question mark above that section between 9 (the total number of strawberries) and 6 (the number of small strawberries). That section represents the large strawberries, which is what my sentence form reminds me that I’m looking for.
Technically, a student could just look at this easy proportional model and say there are 3 large strawberries because it’s right there in front of them. So some people might think this journal is just too easy, but at the end of the day, students are solidifying the process. They’re going back up to the problem and putting a check when they add Xs or circles for the six small strawberries. They’re putting in a check when they’ve talked about putting in the large strawberries. Then they put a question mark to show what we’re looking for. There’s a lot of detail that we’re looking for kids to have to interact with the text in math to show the comprehension.
In some of our schools, we will do a unit bar at the bottom of the page. In the 1st grade journal we’ve created for Math4Littles, we’re going to leave the bar off and introduce the non-proportional bar a little bit later in the year. There is nothing wrong with having a model of the proportional bar and then underneath it having the non-proportional bar. In our journal, we plan to show the proportional bar, and then bring in both types of bars so that kids could see the relationship between the two. If where about this non proportional bar, where would I slice it to put the nine in? And then where’s my question mark? is it labeled? etc.
The integral parts of visual models are: labelling the who or what, taking the bar and adjusting it based on the information that’s given, and writing in their question mark. Then it’s time to solve!
Computation. Although this step might not seem necessary because our sample problem is so simple, and to first graders after they do so many, it seems simple and both teachers and students might wonder why they’re even doing it, but I can promise that these problems will become more complex, very quickly. In our 1st grade journal, we will feature this look at the proportional bar, and then transition to having proportional and non proportional models, and then eventually just leaving it blank and having the student put in a non proportional bar to see that they can develop this progression.
1st Grade Goals
The goal is, by the end of their first grade year, students should be able to solve problems with larger numbers and a non-proportional bar. You certainly don’t want to rush that progression. 1st grade is a really nice scaffold for students to get to that point of independence, because when we get to 2nd grade, we don’t do a whole lot of scaffolding. There are more open-ended sentences, more blanks, and students are doing more of the work.
Additionally, we want to mix up the types of problems we’re solving, give students time to understand them. You might do three days of part-whole addition to see if they can get it under their belt. Then do some part-whole subtraction, then mix the two to see if students are just following a pattern where we’re adding today or subtracting today. We want to know that they can really apply what they’re learning. Multi-step problems, where students have to add and then subtract, or vice versa, are next. Give students lots of good practice, and then mix it up again to see if they’re really following the words, or if they’re just learning a procedure. The last type of problem that we would integrate in the first grade is additive comparisons.
Video Tutorials
In the video tutorials, you’ll see aspects of four different problems being displayed. Some will have the proportional bar, some will have the proportional and the non proportional and some just won’t have it just so you can get an overall idea of what this looks like as we go.
[yotuwp type=”playlist” id=”PL76vNL0J-a405ysBIwEwXfaMp5883yGh4″ ]
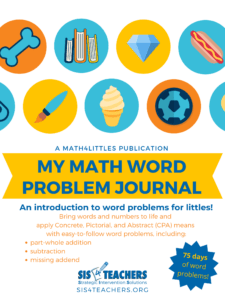
As you watch the videos, think about how you could set this up in your classroom, starting with some of the sample problems that we’re offering as a free download today. We will be releasing a full 1st grade journal soon, so stay tuned!
Join us next week for problem solving in 2nd grade: What are the different problems that 2nd grade is going to encounter? How are journals coded? As we start to look at how journals are coded, which you certainly could use these tutorial videos right away in your classroom or in your distance learning by thinking about story problems in a different way.